Black Monday may have occurred almost 30 years ago but few have forgotten it.
The Australian share market’s single day fall (our Black Tuesday) of almost 25% in October 1987 changed markets and still serves as a reminder of the potential magnitude of outlier events.
Such falls between trading periods – gap risks – are exceedingly rare but remain a real risk.
Stocks are naturally exposed to gap risks (a share may close at $5 and then open the following day at $4), but so too are many portfolios. For example, a 70:30 growth/defensive fund would post a 17.5% loss in the 1987 scenario.
It’s important that investors understand the magnitude and frequency of gap risk events if they are to judge whether to protect against them and, if so, which is the most efficient strategy to choose.
A rare event
Since 1984, the All Ordinaries Index has recorded just two periods of single day market losses greater than 10%. There were 18 days of single day market losses greater than 5% over a total of 7939 days representing 0.23% of trading days.
It shows that significant market gap events are infrequent. Meanwhile, their size has been curtailed by new rules introduced by many global exchanges since 1987.
Figure 1: All Ords largest single day market falls (1984–2015)
| Date | Daily fall (%) |
| October 20, 1987 | 24.959 |
| October 28, 1997 | 10.779 |
| October 16, 1989 | 8.709 |
| October 10, 2008 | 8.2 |
| October 27, 1987 | 8.106 |
| October 29, 1987 | 7.614 |
| January 22, 2008 | 7.262 |
| October 23, 1987 | 7.06 |
| October 16, 2008 | 7.005 |
| April 17, 2000 | 6.88 |
| October 26, 1987 | 6.711 |
| November 4, 1987 | 5.621 |
| August 9, 2011 | 5.603 |
| September 30, 2008 | 5.582 |
| November 13, 2008 | 5.438 |
| August 16, 2007 | 5.356 |
| September 17, 2001 | 5.173 |
| October 8, 2008 | 5.087 |
| Source: Milliman analysis of Bloomberg data. Note: Single day percentage loss defined as the difference between the day low with the previous day market close. | |
Most global exchanges instituted market-wide circuit breakers following the 1987 crash, which has effectively limited the magnitude of single day gap events.
For example, if the S&P 500 drops past a 7% threshold, the market shuts down for 15 minutes. If it then drops past a 13% threshold, the market shuts down for another 15 minutes. If it then drops by 20%, the market shuts down for the rest of the day.
The Australian Securities Exchange implements similar circuit breakers on a discretionary basis.
Protection strategies
While gap events are rare, risk-averse investors who still want protection have several possible strategies to consider.
Reducing exposure to risky assets
Investors can reduce or eliminate their exposure to growth assets and raise their allocation to cash or risk-free bonds. Alternatively, they can invest in an insurance company guarantee or annuity.
Unfortunately, given the current market environment of historic low interest rates, these approaches are also likely to provide extremely low returns.
Options: a costly approach
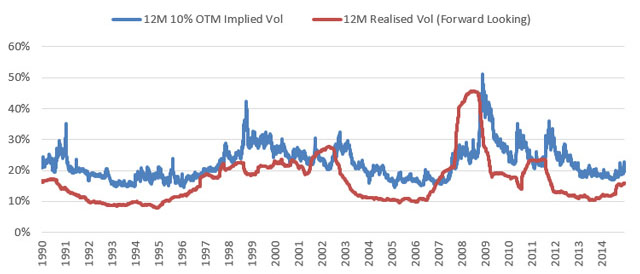
Option prices are typically quoted as implied volatility, which usually trade at a premium to the realised volatility of the underlying security. In effect, option buyers pay option sellers an added premium to cover unexpected market risks, including low probable events such as gap risk.
For example, the following graph shows the market implied volatility for 12-month “10% Out of The Money” put options for the S&P 500 index. On average, for the entire history shown (1990-2014), implied volatility has been 2.95 percentage points greater than realised volatility. Since 2010, this implied volatility premium has averaged 4.20 percentage points greater than realised.
In pricing a 12-month 10% ‘Out of the Money’ put, this extra 3% to 4% implied volatility premium roughly equates to an added 100- 150 bps per annum cost of protection.
Figure 2: SPX implied vs. realised volatility - 12 month tenor

Source: Milliman analysis of Bloomberg data.
Typically, funds attempt to reduce the high cost of put option premiums with spread trades or by purchasing low probability ‘tail risk’ options. While these strategies can reduce costs, they also only provide partial protection against gap events.
For example, while 20% ‘out of the money’ puts are relatively cheap compared to ‘at the money’ options, the option holder wouldn’t benefit unless the market fell by at least 20%. If the market fell by 25%, the investor would still absorb more than 80% of the total loss.
More complex option trading strategies can also be employed, although these are more akin to discretionary bets which can’t fully protect against a gap event.
Systematic dynamic hedging: Transparent and cost-effective
Dynamic exposure management via equity futures is a lower-cost risk management strategy than options, offering greater transparency and liquidity. Exchange-traded futures offer additional benefits including lower transaction costs, flexibility, scalability and daily cash settlement.
The strategy is particularly effective at protecting portfolios against more normal drawdowns which occur over longer periods – these are far more common than gap events as shown in the table tracking the S&P 500 below.
Figure 3: S&P 500 drawdowns greater than 15% (December 31, 1969 – July 1, 2013)
| Drawdown | Length | Recovery | Peak | Valley |
| -50.95% | 16 months | 37 | Oct 31 2007 | Feb 28 2009 |
| -44.73% | 25 | 49 | Aug 31 2000 | Sep 30 2002 |
| -42.65% | 21 | 21 | Dec 31 1972 | Sep 30 1974 |
| -29.58% | 3 | 18 | Aug 31 1987 | Nov 30 1987 |
| -19.48% | 6 | 6 | Dec 31 1969 | June 30 1970 |
| -16.52% | 20 | 3 | Nov 30 1980 | July 31 1982 |
| -15.37% | 2 | 3 | June 30 1998 | Aug 31 1998 |
| Source: Milliman analysis of Bloomberg data | ||||
But while dynamic hedging is more efficient at managing typical market drawdowns over a period of time, the strategy does not explicitly guarantee protection against gap events. As outlined above, options provide gap risk protection, albeit the buyer of the option may be paying a significant premium to protect against extremely low probability gap events.
Further, depending upon the parameters used within the dynamic hedging strategy, risk associated with gap events can be mitigated. Because gap events often strike during periods of high volatility, strategies that incorporate managed volatility would have potentially lower exposure to risky assets during gap events.
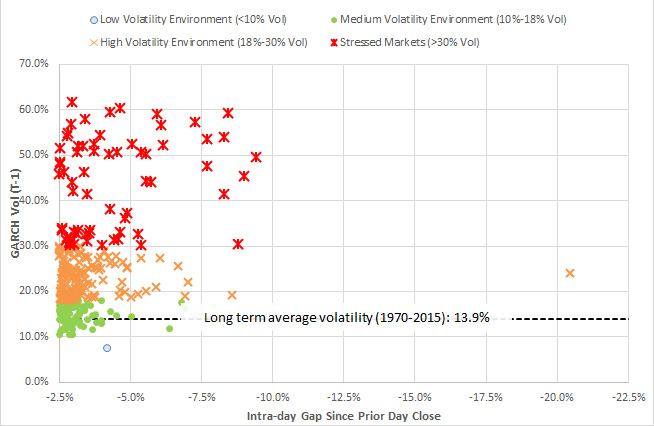
The following table illustrates the level of volatility on the day before the S&P 500 posted a loss greater than 2.5%. The red ‘stressed markets’ indicators show that the majority of negative gap events occurred in periods of higher than average volatility – periods when managed volatility strategies would have reduced those losses.
Figure 4: SPX gap events (>2.5% intra-day decline) (1987-2015)

Source: Milliman analysis of Bloomberg data.
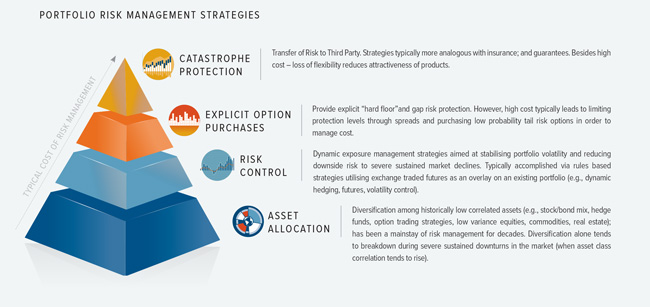
A holistic approach: Layering risk management strategies
Portfolio diversification stands on the front line of risk management. However, a more sophisticated and effective approach employs a range of strategies, including low-cost and transparent dynamic futures hedging providing the bulk of risk control.
Depending on an investor’s risk tolerance, further risk management strategies can be combined to tailor particular outcomes cost effectively. For example, lower-cost tail risk options can also provide extra hard floor protection to dynamic exposure management strategies.
In comparison to strategies that depend solely upon high-cost options for the bulk of risk management, a layered approach will be more predictable, scalable and cost-effective.
Figure 5: Portfolio risk management strategies

This document has been prepared by Milliman Pty Ltd ABN 51 093 828 418 AFSL 340679 (Milliman AU) for provision to Australian financial services (AFS) licensees and their representatives, [and for other persons who are wholesale clients under section 761G of the Corporations Act].
To the extent that this document may contain financial product advice, it is general advice only as it does not take into account the objectives, financial situation or needs of any particular person. Further, any such general advice does not relate to any particular financial product and is not intended to influence any person in making a decision in relation to a particular financial product. No remuneration (including a commission) or other benefit is received by Milliman AU or its associates in relation to any advice in this document apart from that which it would receive without giving such advice. No recommendation, opinion, offer, solicitation or advertisement to buy or sell any financial products or acquire any services of the type referred to or to adopt any particular investment strategy is made in this document to any person.
The information in relation to the types of financial products or services referred to in this document reflects the opinions of Milliman AU at the time the information is prepared and may not be representative of the views of Milliman, Inc., Milliman Financial Risk Management LLC, or any other company in the Milliman group (Milliman group). If AFS licensees or their representatives give any advice to their clients based on the information in this document they must take full responsibility for that advice having satisfied themselves as to the accuracy of the information and opinions expressed and must not expressly or impliedly attribute the advice or any part of it to Milliman AU or any other company in the Milliman group. Further, any person making an investment decision taking into account the information in this document must satisfy themselves as to the accuracy of the information and opinions expressed. Many of the types of products and services described or referred to in this document involve significant risks and may not be suitable for all investors. No advice in relation to products or services of the type referred to should be given or any decision made or transaction entered into based on the information in this document. Any disclosure document for particular financial products should be obtained from the provider of those products and read and all relevant risks must be fully understood and an independent determination made, after obtaining any required professional advice, that such financial products, services or transactions are appropriate having regard to the investor's objectives, financial situation or needs.
All investment involves risks. Any discussion of risks contained in this document with respect to any type of product or service should not be considered to be a disclosure of all risks or a complete discussion of the risks involved.